As we continue our journey of creating a production ready REST API, we will need to start adding some additional non-functional capabilities to the application. We will be using our existing Customer API application as a base for our continued work. Check out the how we built the base application in the post “Building a Customer API using Quarkus From the Ground Up“.
Health checks are an absolutely necessary piece of any application, especially when running in a Kubernetes environment like OpenShift. When the pods are being scheduled and started, it tells Kubernetes when they are ready to be added to the service to accept requests.
However, there is actual two pieces to health checking. The liveness check provides feedback on whether or not application is up and running. Of course, we don’t want to route requests to something not running. But the more important piece of health checking is its sibling, the readiness check. The readiness check not only provides feedback that the application is up and running, but that it’s actually ready to begin serving. Many times, there are gaps between the two.
For example, with our Customer API, we will want to check to make sure the integration points are ready and connected. We want to make sure the database is there and up to speed. We would also want to check that we can connect out to any messaging infrastructure, such as a Kafka cluster, prior to serving any load. There are other use cases as well, such as cache loading, which will need to be performed prior to joining the service.
MicroProfile Health
Because Quarkus supports MicroProfile, we are going to use the MicroProfile Health extensions. Let’s update the pom to add the extension.
<dependency>
    <groupId>io.quarkus</groupId>
    <artifactId>quarkus-smallrye-health</artifactId>
</dependency>
Per the documentation, importing the smallrye-health extension directly exposes three REST endpoints:
/q/health/live– The application is up and running./q/health/ready– The application is ready to serve requests./q/health– Accumulating all health check procedures in the application.
Side Quest: Starting the application in DEV mode
We’ve gotten the application to run successfully with only ./mvnw test but we need to do an extra step to support starting the application in DEV mode. For this piece, we are going to want to take a look at the actual json output from the health checks to be able to develop our health check tests properly.
We need a database for dev mode. I would absolutely love to use Testcontainers for this but the Quarkus dev mode runs on a different maven profile and does not recognize to use the test dependencies. If I wanted to hack it, I could just add the dependencies without the <scope>test</scope> tags, but then the Testcontainers libraries would be added into the actual deployment. No thanks to that. The next best solution is to run PostgreSQL as a container on my local.
PostgreSQL using docker-compose
version: '3.8'
services:
  postgres:
    image: postgres
    restart: always
    ports:
      - "5432:5432"
    environment:
      POSTGRES_DB: customer_db
      POSTGRES_USER: test
      POSTGRES_PASSWORD: password
Just start the container using docker-compose up -d and we have our running database. The next step is adding in the dev profile in our application.yaml
"%dev":
  quarkus:
    log:
      level: INFO
      category:
        "dev.rhenergy":
          level: DEBUG
    datasource:
      username: test
      password: password
      jdbc:
        url: jdbc:postgresql://localhost:5432/customer_db
    hibernate-orm:
      log:
        sql: true
    flyway:
      migrate-at-start: true
      locations: db/migration,db/testdata
Now, you can start the application in dev mode.
./mvnw clean quarkus:devExtra bonus: Testcontainers will still run perfectly even with the other container running. It detects port conflicts and just increments so you can leave the docker-compose process running and still execute maven tests.
Testing the Database Health Check
Now that the health check extensions are installed, let’s do a sanity check. Of course you can do this by simply hitting the /health endpoint and see the json responses, but I wanted to highlight the Health UI. The Quarkus smallrye-health extension ships with health-ui and enables it by default in dev and test modes, but it can also be explicitly configured for production mode as well. Let’s take a look at http://localhost:8080/q/health-ui
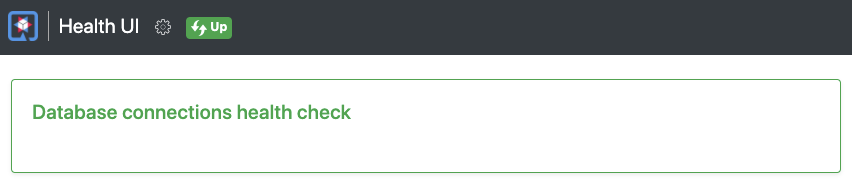
All green. Now, let’s go turn it red. Shut down that database using docker-compose down and let’s see what happens.
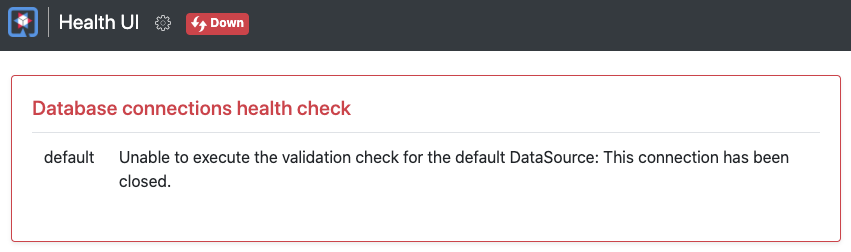
Pretty good functionality for simply adding an extension.
Check Testing
So we added new functionality? That means we should be adding new tests as well and they should be automated. Most of these kind of tests are really just sanity checks for the development team. Write it and plug it in and you’ll never been bitten by something unknowingly happening to this functionality.
@QuarkusTest
public class HealthCheckTest {

    @Test
    public void getHealth() {
        given()
                .when().get("/health")
                .then()
                .statusCode(200)
                .body("status", Matchers.equalTo("UP"));
    }

    @Test
    public void getDatasourceHealth() {
        given()
                .when().get("/health/ready")
                .then()
                .statusCode(200)
                .body("status", Matchers.equalTo("UP"));
    }

}
Health Check Finished. Another step toward production.
Tag: https://github.com/rhenergy/customer-api/tree/ADDED_HEALTH_CHECKS